Fed set to cut rates after 9-month pause
- Fed likely cuts by 25bps to 4.00–4.25%
- Focus on dot plot and Powell’s remarks
- Markets price more cuts through 2026
- Dovish tone may lift stocks, metals and weaken USD
- Hawkish tone may strengthen the dollar
Today, Wednesday, September 17, global markets are focused on the U.S. Federal Reserve’s policy meeting.
After a nine-month pause, the Fed is widely expected to deliver its first rate cut of 2025 by 25 basis points, bringing the target range down to 4.00–4.25%.
The move is driven by signs of a cooling labor market and easing inflation, which has retreated from its peaks but remains vulnerable amid tariff-related pressures.
Investors’ attention extends beyond the rate decision itself to the updated “dot plot,” the Fed’s statement tone, and Chair Jerome Powell’s press conference, all of which will shape expectations for October and December.
The “dot plot” is a chart showing policymakers’ individual forecasts for the future path of interest rates, with each dot representing one member’s projection.
As of September 16, the CME FedWatch Tool displayed nearly a 100% probability to today’s cut.
Markets also price in another reduction in October (≈81%) and two more by year-end, which would bring the target rate to 3.50–3.75%. By early 2026, odds of a move to 3.25–3.50% exceed 80%, while futures suggest 2.75–3.00% by late 2026 with roughly 75% probability. This implies five to six cuts through 2026—considerably more aggressive than prior Fed projections.
Such a path may support riskier assets such as stocks; commodity-linked currencies, and precious metals, while pressuring the dollar.
A dovish message from the Fed could fuel gains in U.S. equity indices, lower Treasury yields, and boost gold & silver.
Conversely, hawkish signals may trigger equity pullbacks, a stronger dollar, and higher yields, weighing on metals.
Historical Bloomberg data over the past year show the sharpest volatility in the first 30 minutes post-announcement typically occurs in XAUUSD (Gold), XAGUSD (Silver), and NAS100 Index, while currency pairs tend to move more moderately.
Fed Dot Plot as of June 18, 2025
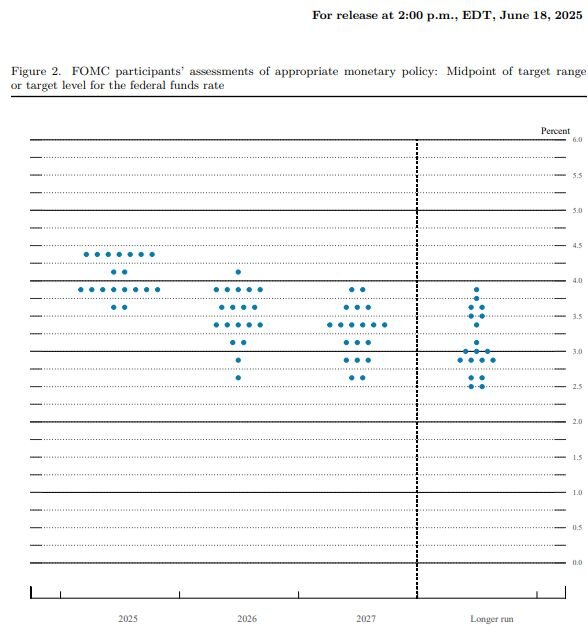
The June dot plot showed most participants still expecting rates around 4.00–4.50% in 2025. For 2026, forecasts drop toward 3.25–3.50%, and by 2027 closer to 3.00%. Longer-term, the Fed sees the “neutral” rate at roughly 2.50–3.00%.
In short, the chart illustrates the Fed’s plan for gradual rate reductions over the coming years as the economy and inflation stabilize.